Commercial real estate capital markets remain priced out, not shut out, but the pressure has begun to move from the benchmark to credit. Treasury yields have eased from their September 30 highs, fixed-rate coupons are only marginally lower, and lenders across every channel remain open. At the same time, CMBS delinquency has risen to 8.02%, and multifamily has crossed above the overall rate for the first time since the pandemic. This edition examines whether a market with abundant capital can keep clearing transactions when both coverage and credit are narrowing the box.
Key Insight Summary
Yields Ease, Coupons Barely Move: The 10-year Treasury closed at 5.10% on October 15, down 19 basis points from September 30, after trading as high as 5.33% on October 14 following September CPI. Fixed-rate indications from the October 12 to 14 survey window sit only about 5 to 6 basis points below October 1 levels.
Inflation Keeps the Fed in Play: September CPI of 3.7% year over year, with core at 2.6%, leaves the October 28 FOMC meeting live. Markets favored a hold at roughly two-thirds odds as of October 14, with a December hike priced near 63%.
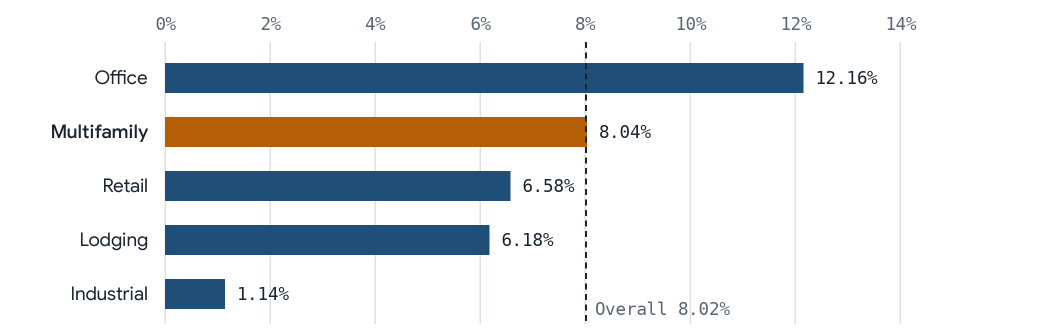
Multifamily Credit Turns: Trepp’s CMBS delinquency rate rose 17 basis points to 8.02% in September. Multifamily rose 35 basis points to 8.04%, the first reading above the overall rate since the pandemic.
Special Servicing Reaches a 13-Year High: The special servicing rate rose to 11.49%, its highest level since February 2013, and matured balloon loans that failed to refinance accounted for 81% of newly delinquent balances in August.
Capital Stays Open: Private-label CMBS and CRE CLO pricing reached $7.8 billion in the week ended October 9, the largest weekly total since June, and 2026 volume of $144.5 billion is running 19.4% ahead of last year.
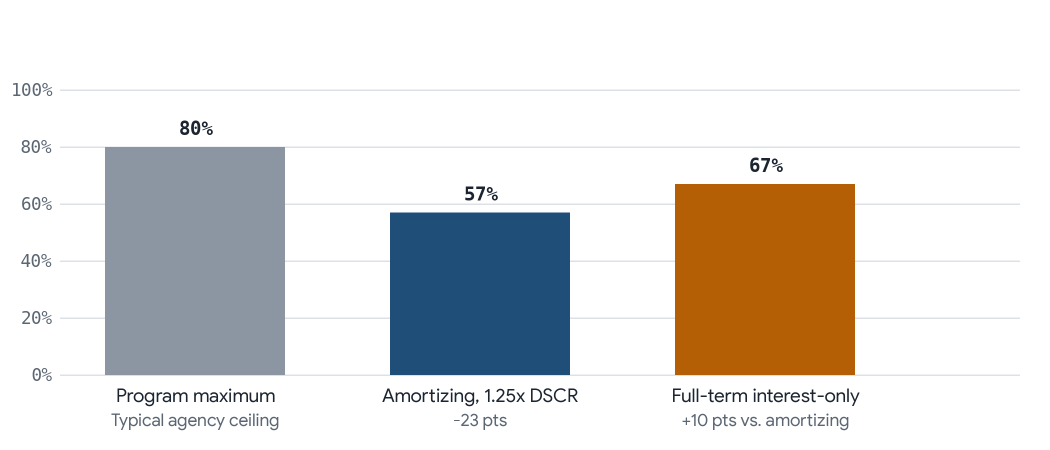
Coverage Sets Proceeds, Not Appetite: At a 6.6% coupon and 30-year amortization, a 1.25x DSCR supports roughly 57% leverage against an 80% program maximum. Full-term interest-only restores about 10 points.
Macro & Monetary Policy Context
The Federal Reserve raised the federal funds target range to 3.75% to 4.00% on September 16, its first increase since 2023. September CPI, released October 14, came in at 3.7% year over year with core at 2.6%. The 10-year Treasury stood at 5.21% on October 13, spiked as high as 5.33% on the print, and then rallied to 5.10% by the close on October 15. If that rally holds, fixed-rate coupons priced during the survey window will be roughly 8 to 10 basis points lower at lock.
Benchmark
October 15
September 30
Change
5-year Treasury
4.91%
5.09%
-18 bps
7-year Treasury
5.00%
5.19%
-19 bps
10-year Treasury
5.10%
5.29%
-19 bps
30-day average SOFR
3.87%
3.75%
+12 bps
Overnight SOFR
3.88%
3.88%
Unchanged
Curve shape matters as much as level. The 5-year to 10-year spread is only about 19 basis points, and the 10-year sits roughly 123 basis points above the 30-day average SOFR. Extending a fixed-rate term from five to ten years therefore costs very little in base rate, and in several programs it lowers the all-in coupon.
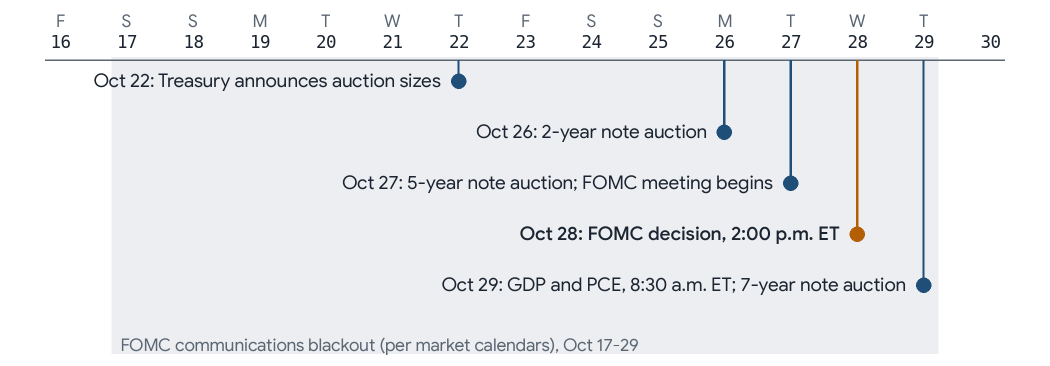
Rate direction over the next two weeks will be set by supply and data rather than Fed commentary. The FOMC communications blackout runs October 17 to 29, the October 28 decision arrives within a heavy run of Treasury auctions, and the first estimate of third-quarter GDP and September PCE inflation follow the next morning.
Market Signals and Developments
Securitization continues to absorb the rate shock. CRE Finance Council data show $7.8 billion of private-label CMBS and CRE CLO pricing in the week ended October 9, the largest weekly total since June, and 2026 private-label volume of $144.5 billion is running 19.4% ahead of last year. CRE CLO issuance is up 58.9%. KBRA’s October 5 outlook flagged up to 18 CMBS deals for the month, including eight single-borrower deals, four conduits, five CRE CLOs, and one Freddie Mac K-Series deal, while cautioning that some could slip given the recent rise in rates.
Single-asset execution remains strong for institutional-quality assets. The $2.0 billion five-year refinancing of 245 Park Avenue priced its Class A bonds at T+100, 22 basis points inside the three-month average, against a loan with an expected 6.1% coupon. That transaction is not available to sub-institutional borrowers, but it shows that bond buyers will still fund well-leased office.
Bank and alternative capital are both gaining share. The Federal Reserve’s July Senior Loan Officer Survey showed moderate and modest net shares of banks easing standards for nonfarm nonresidential and multifamily loans. CBRE’s second-quarter report put alternative lenders at 38% of non-agency closings, up from 34% a year earlier, with banks at 30%, life companies at 21%, and CMBS lenders at 11%, down from 19%.
Credit is where the strain shows. Trepp’s CMBS delinquency rate was 8.02% in September, up from 7.85% in August, and would be 9.66% including loans past maturity but current on interest. The current cycle is driven mainly by loans that cannot refinance at maturity rather than by borrowers missing monthly payments, which is why higher coupons matter more than lender appetite.
Market Pricing Snapshot Table
Capital Source
September 2026
October 1, 2026
October 16, 2026
Agencies (Fannie/Freddie)
5.42%–6.19%
6.14%–6.84%
6.08%–6.78%
Life Companies (Multifamily)
5.79%–7.06%
6.38%–7.57%
6.35%–7.60%
Life Companies (Commercial)
6.04%–7.11%
6.55%–7.62%
6.39%–7.29%
Banks (Fixed)
5.50%–6.50% (est.)
6.25%–7.25% (est.)
6.07%–7.07% (est.)
Debt Funds / Bridge (Floating)
275–375 bps + SOFR
275–375 bps + SOFR (est.)
275–375 bps + SOFR (est.)
CMBS Conduit
6.37%–6.89%
6.98%–7.50%
6.96%–7.44%
Methodology: Bank and debt fund ranges are market-observed estimates rather than published rate sheet figures; the October 16 bank estimate holds the prior estimated spread over the 5-year Treasury constant against the current index. Index levels as of October 15, 2026: 5-Year Treasury 4.91%, 7-Year Treasury 5.00%, 10-Year Treasury 5.10%, 30-day average SOFR 3.87%. October 16 pricing ranges reflect rate surveys dated October 12 through October 14 and may sit modestly above levels implied by the October 15 closing indices. All rates are informational and subject to change.
Indicative Ranges by Capital Source
All figures below are unattributed market indications observed for the week of October 12 to 14, 2026. They are not quotes or commitments. Spreads are over the matched Treasury at the survey date unless noted, and FHA/HUD rates are before mortgage insurance premium.
Capital Source
Term / Structure
Leverage / Coverage
Spread (bps)
Note Rate
Freddie Mac
10-yr fixed
55%
95–110
6.14%–6.29%
Freddie Mac
10-yr fixed
80%
115–130
6.34%–6.49%
Freddie Mac
7-yr fixed
80%
135–150
6.44%–6.59%
Freddie Mac
7 and 10-yr ARM
65%
Floating
5.80%–5.90%
Fannie Mae
10-yr fixed
55% / 1.55x
89–119
6.08%–6.38%
Fannie Mae
10-yr fixed
80% / 1.25x
119–159
6.38%–6.78% (some to 6.85%)
Fannie Mae
5-yr fixed
80% / 1.25x
146–186
6.45%–6.85%
Fannie Mae
7 and 10-yr SARM
75% / 1.00x
Floating
6.08%–6.20%
FHA/HUD 223(f)
35-yr fully amortizing
Up to 87% / 1.15x
n/a
6.30%–6.45%
FHA/HUD 223(a)(7)
Up to 40-yr amortization
Refinance of existing FHA loan
n/a
6.30%–6.45%
FHA/HUD 221(d)(4)
40-yr construction/perm
Up to 87% LTC
n/a
6.75%–6.90%
Life company, commercial
5-yr fixed
Up to 60%
140–170
6.39%–6.69%
Life company, commercial
10-yr fixed
Up to 60%
130–160
6.49%–6.79%
Life company, commercial
10-yr fixed
Up to 75%
180–210
6.99%–7.29%
Life company, multifamily
10-yr fixed
50%–60%
n/a
6.35%–6.90%
Life company
15-yr fully amortizing
60%
n/a
6.90%–7.60%
CMBS conduit
5-yr fixed
Up to 75%
225–275
7.24%–7.74%
CMBS conduit
10-yr fixed
Up to 75%
175–225
6.96%–7.44%
Bank / debt fund
Floating bridge
Varies
Not observed
Estimated; see snapshot above
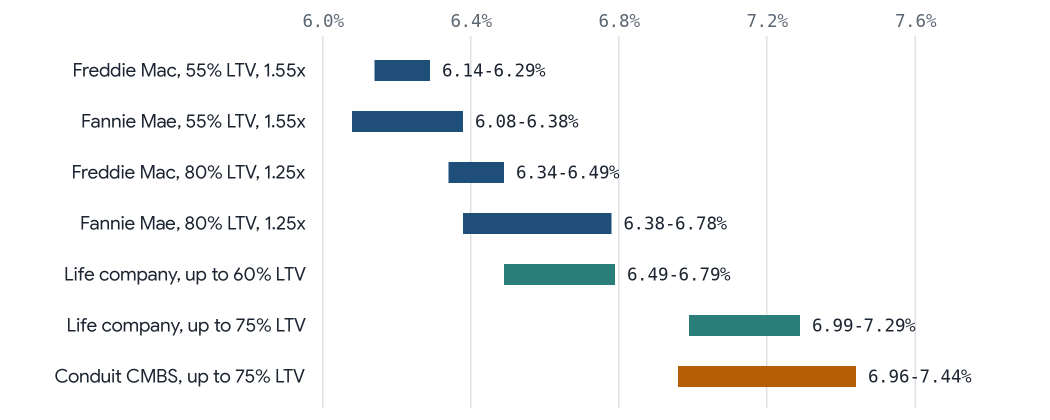
Several relationships matter more than any single number. On the 10-year term, agency spreads at 55% leverage run roughly 40 basis points inside low-leverage life company spreads and roughly 100 basis points inside conduit spreads, measured at range midpoints. Within the life company bucket, moving from 60% to 75% LTV adds about 50 basis points of spread, which is the clearest sign that life companies want low leverage and will price to discourage the rest. Conduit 5-year spreads are about 50 basis points wider than 10-year spreads, so the 5-year conduit coupon is higher than the 10-year despite a lower base rate. The same pattern appears in Fannie Mae’s 80% tier, where the 10-year indication sits slightly below the 5-year.
Capital Source Activity
Capital Source
Appetite
Leverage Posture
Spread Direction
Execution Risk
Fannie Mae / Freddie Mac
Strong; cap room ample
Up to 80% fixed, 75% SARM; DSCR usually binds
Stable to slightly wider
Low for clean stabilized deals; rising scrutiny where delinquency is concentrated
FHA/HUD
Steady
Highest leverage, longest amortization
Stable
Timeline risk; rate exposure during processing
Life companies
Selective; prefer low leverage
50%–65% sweet spot
Stable at low leverage, wide above 65%
Low once approved; strict on asset quality and sponsor
CMBS conduit
Open but thin
Up to 75%, heavy interest-only
Widest fixed option; bond spreads steady
Market-window and rate-lock risk
Banks
Improving
Moderate, recourse common
Relationship-driven
Deposit and concentration constraints vary
Debt funds / CRE CLO
Active
Highest non-agency leverage
Bond-level spreads stable
Pricing and structure risk if SOFR rises
Agencies (Fannie Mae and Freddie Mac)
Ten-year fixed execution spans 6.08% to 6.78%, about 6 basis points inside October 1 on both ends. Freddie Mac prices tighter at 80% leverage, at 6.34% to 6.49% against 6.38% to 6.78% for Fannie Mae, while Fannie’s 55% tier is competitive at 6.08% to 6.38%. Floating structures at 5.80% to 6.20% run roughly 35 to 60 basis points below comparable fixed execution, an advantage that is exposed to a further hike.
FHFA set 2026 multifamily purchase caps at $88 billion each for Fannie Mae and Freddie Mac, and qualifying workforce housing loans are excluded from the caps, so volume is not the constraint. CREFC’s tally of agency securitization shows Freddie Mac at $65.0 billion year to date, up 30.1%, while Fannie Mae is at $46.2 billion, down 8.7%, a divergence consistent with Freddie’s tighter fixed spreads. Credit has drifted modestly: MBA’s second-quarter report showed Fannie Mae’s 60-day delinquency rate at 0.60% and Freddie Mac’s at 0.51%, both low in absolute terms. We expect the agencies to remain the default execution for stabilized multifamily, with closer underwriting of trailing collections, concessions, and submarket supply.
FHA/HUD
FHA/HUD 223(f) loans price at 6.30% to 6.45% and 221(d)(4) at 6.75% to 6.90%, both before mortgage insurance premium, giving the highest leverage and longest amortization available. The tradeoff is processing time. With the 10-year moving more than 20 basis points inside a single week, the gap between application and rate lock is a real cost, and HUD fits borrowers who value 35- to 40-year fixed, non-recourse debt more than speed.
Life Companies
Ten-year fixed pricing runs 6.49% to 6.79% up to 60% leverage and 6.99% to 7.29% up to 75%, so the last 15 points of leverage cost about 50 basis points of spread. MBA’s survey shows $76 billion of life company balances maturing in 2026, about 10% of their book, which gives them a steady refinancing pipeline from existing borrowers. Portfolio delinquency rose to 0.48% in the second quarter, up 10 basis points, which remains low but supports their discipline. Life companies are the best execution for low-leverage industrial, grocery-anchored retail, and high-quality multifamily, provided the sponsor can accept a 55% to 65% loan.
Banks
Appetite is improving, particularly for relationship borrowers on owner-occupied and mid-balance stabilized deals. Bank of America reported $75.2 billion of CRE loans, up 12.3% year over year, while PNC reported CRE balances up 4% from the prior quarter with nonperforming loans up 8%, driven partly by previously reserved office loans. MBA’s second-quarter bank and thrift delinquency rate was 1.20%. No bank pricing was observed this period, so fixed-rate execution is estimated at 6.07% to 7.07%. Recourse, deposit relationships, and concentration limits vary widely by institution.
Debt Funds and Private Credit
Bridge pricing is estimated at 275 to 375 basis points over SOFR, an all-in range near 6.63% to 7.63% on overnight SOFR of 3.88%, though no bridge pricing was observed this period. AAA discount margins on the three CRE CLOs priced in the week ended October 9 were S+145 to S+155, and those pools carried weighted-average as-is LTVs of roughly 68% to 69%, NCF DSCRs of 1.01x to 1.05x, and NOI debt yields of 5.1% to 5.8%. Bridge lenders are therefore underwriting business plans rather than in-place income, which works only if the stabilization assumptions prove right and the Fed holds near current levels.
CMBS Conduit & CRE CLOs
Ten-year conduit execution runs 6.96% to 7.44%, and five-year execution runs 7.24% to 7.74%. The conduit that priced in the week ended October 9 was the first non-multifamily conduit to price since August 18. Its AAA last-cash-flow bonds priced at T+83, level with the three-month average, and its pool carried a 59.9% weighted-average LTV, a 1.71x DSCR, and 81.8% full-term interest-only. Execution favors moderate-leverage, high-coverage loans that rely on interest-only to work, and it remains the most rate-sensitive channel.
Asset Class & Buyer/Seller Sentiment
Property Type
Debt Sentiment
Key Data
Lender Posture
Multifamily
Stable for stabilized, cautious for transitional
Q3 vacancy 8.6%; CMBS delinquency 8.04%
Agencies anchor; bridge credit under watch
Industrial
Positive
CMBS delinquency 1.14%
Broadest appetite across sources
Retail
Improving
CMBS delinquency 6.58%, down 62 bps in September
Life companies and banks receptive to necessity retail
Office
Bifurcated, still impaired
Q3 vacancy 19.8%; CMBS delinquency 12.16%
Financing exists for well-leased assets; limited for the rest
Hospitality
Cautious
Lodging CMBS delinquency 6.18%, up 34 bps
Floating-heavy refinance pipeline under pressure
Assisted living / health care
Cautious
MBA: Q2 health care originations down 19% year over year
Specialized lenders and HUD; limited conventional depth
Self-storage
Stable (limited fresh data)
No new national debt data this period
Life companies and banks for stabilized assets
Multifamily
Multifamily shows the sharpest split of any sector between capital availability and credit performance. Cushman & Wakefield reported third-quarter national vacancy down 30 basis points to 8.6%, the third consecutive decline, and Yardi Matrix data show September asking rents up 0.7% year over year, the first third-quarter rent increase in four years. Yet multifamily CMBS delinquency rose 35 basis points in September to 8.04%, the first time since the pandemic that it exceeded the overall rate. The stress originates in the 2021 to 2022 vintage: floating-rate and short-term fixed loans underwritten at low cap rates and aggressive rent growth that are now meeting 6% to 7% permanent coupons. Stabilized assets with real trailing income will finance well through the agencies, while transitional assets face tighter proceeds and larger equity requirements.
Industrial
Industrial remains the easiest sector to finance outside multifamily, with CMBS delinquency of 1.14%, the lowest of any major property type. The variable to watch is speculative supply in submarkets with heavy deliveries.
Retail
Retail shows the clearest improvement in CMBS credit, with delinquency falling 62 basis points in September to 6.58%. Grocery-anchored and necessity retail with durable occupancy is receiving fair treatment from life companies and banks. Retail special servicing rose 24 basis points to 13.84%, however, so lenders still discriminate sharply by center type.
Office
National office vacancy has begun to improve, with Cushman & Wakefield reporting third-quarter vacancy of 19.8%, down about 30 basis points from the third-quarter 2025 peak, and MBA reporting strong year-over-year office originations in the second quarter. Credit remains the weakest of any sector, with CMBS delinquency at 12.16% and special servicing at 16.85%. Financing is available for well-leased, well-located buildings with term on the rent roll. For buildings facing near-term rollover, the realistic paths are recapitalization, sale, or a lender negotiation rather than a new loan.
Hospitality
Lodging delinquency rose 34 basis points to 6.18% and special servicing rose 21 basis points to 8.95%. The refinance pipeline is heavily floating-rate, and higher energy costs and slowing wage growth are a risk to leisure demand. We would treat hotel refinancing as an equity-sizing exercise first and a debt-sourcing exercise second.
Assisted Living, Self-Storage and Owner-Occupied
No new national debt-specific data were available for these sectors this period, so the following reflects our judgment. Assisted living lending remains concentrated among HUD, specialized balance-sheet lenders, and select banks, consistent with MBA’s report of a 19% year-over-year decline in second-quarter health care originations. Stabilized self-storage remains financeable with life companies and banks at conservative leverage. Owner-occupied borrowers benefit most from the improved bank posture in the July survey, and because those loans are underwritten on business cash flow as much as on real estate, third-quarter operating results will drive sizing.
Credit and Refinancing Risk
Maturity Wall
MBA’s survey shows $875 billion, about 17% of the $5.0 trillion of outstanding commercial and multifamily mortgages, scheduled to mature in 2026, with another $652 billion in 2027. MBA characterized 2026 as past the peak of the maturity wave, but that judgment was made in February against a forecast that the 10-year Treasury would average 4.2% in 2026, and the 10-year is now roughly 90 basis points higher. Volume is declining, yet each loan maturing now refinances into a materially higher coupon than was expected at the start of the year.
Delinquency
Trepp’s overall special servicing rate rose seven basis points in September to 11.49%, its highest level since February 2013. In August, non-performing matured balloon loans made up 81% of newly delinquent balances, so the cycle is driven by loans failing to refinance rather than by borrowers missing payments. Delinquency outside CMBS remains contained: MBA’s second-quarter rates were 1.20% for banks, 0.48% for life companies, 0.60% for Fannie Mae, and 0.51% for Freddie Mac.
Extension and Modification Behavior
Lenders are still extending loans where the sponsor brings something to the table, but extensions are getting shorter and more conditional. In one widely reported September case, Hudson Pacific Properties said the $1.1 billion CMBS loan on its Hollywood Media Portfolio, which had defaulted at maturity, was extended to November 9, 2027 with the stated interest rate unchanged and no principal paydown required at closing. The terms included a $20 million leasing reserve and an excess cash flow sweep, and the sponsor swapped SOFR at 3.50% through maturity. That rate is far below today’s market coupons, which shows how large the refinancing problem is for 2021 vintages. We have not independently verified the terms of that modification. Our observation from current workouts is that servicers increasingly want a paydown, new equity, cash management, or a defined exit in exchange for time.
Debt Service Coverage Pressure
At a 6.6% coupon on 30-year amortization, the annual debt constant is about 7.7%, so a 1.25x DSCR requires roughly a 9.6% debt yield. At an illustrative 5.5% cap rate, an amortizing loan is constrained to roughly 57% LTV, well below the 80% program maximum, while full-term interest-only lifts supportable leverage to about 67%. This is why interest-only has become the main sizing tool in conduit and agency execution, and why borrowers who financed 2021 vintages at 4% coupons face a proceeds shortfall even when NOI has grown.
Interpretation of Lender Behavior and Capital Conditions
The October 1 edition named the regime priced out, not shut out: lenders open, spreads stable, and the borrower’s capacity to use that capital impaired by the benchmark. That regime remains in place. Lenders have not retreated, securitization is running ahead of last year, and spreads have held. What has changed in two weeks is the source of pressure. The benchmark has eased from its September 30 level, but credit performance has deteriorated, and multifamily, the sector with the most competitive execution, is now leading the increase in delinquency.
In classification terms, the market remains in a Benchmark Volatility Phase, with Refinance Pressure Cycle characteristics more pronounced than on October 1. Our directional call is cautious. Liquidity is stable to improving, while credit and rates are deteriorating, and we weight the factors as follows.
Factor
Weight
Direction
Comment
Rates and Fed path
High
Negative
September CPI of 3.7% and a Fed median projecting one more 2026 hike keep the long end elevated
CMBS credit performance
High
Negative
Delinquency above 8% and special servicing at a 13-year high; multifamily now leading the increase
Capital availability
Medium
Positive
Securitization volumes up, agency caps ample, bank standards easing
Property fundamentals
Medium
Modestly positive
Vacancy declining in office and multifamily in third-quarter data
Labor market
Medium
Mixed
September payrolls of 29,000 and 4.2% unemployment soften rate pressure but raise demand risk
Capital supply is not the binding constraint for most borrowers; coverage at today’s coupons is. A market in which lenders want to lend but cannot size loans to the borrower’s needs is not distressed. It is cautious, and it rewards preparation. We would move toward stable if the 10-year settles below 5% and the October and December FOMC meetings pass without a hike. We would move toward deteriorating if a hike pushes the 10-year back above 5.3%, or if Trepp’s October multifamily delinquency figure shows a second consecutive large increase.
Implications for Borrowers and Investors
What Lenders Will Ask
Expect credit committees to focus on trailing 3- and 12-month collections rather than rent rolls alone, concessions and bad debt in multifamily, lease rollover and tenant credit in commercial assets, and sponsor liquidity relative to the loan. For refinances, lenders will want a clear explanation of how any proceeds shortfall will be covered, and what the deal looks like if rates rise another 25 to 50 basis points before lock.
Structuring Recommendations
Size to coverage, not to LTV. Run proceeds at today’s indicative coupon plus a 25 basis point cushion. If the deal only works at the bottom of the indicative range, it is not a reliable deal.
Favor 7- to 10-year fixed terms over 5-year terms. With the 5-year to 10-year spread near 19 basis points, and 10-year conduit and 80% Fannie Mae indications at or below their 5-year equivalents, the longer term costs little or nothing. Weigh yield maintenance or defeasance against the business plan, and consider step-down prepayment structures where offered.
Use interest-only selectively. Partial or full-term interest-only is the most effective proceeds lever available. It also shifts refinancing risk to maturity, and lenders price that in.
Match the lender to the asset before going to market. Low-leverage, high-quality assets belong with life companies. Stabilized multifamily belongs with the agencies, comparing Freddie Mac and Fannie Mae at each leverage tier. Moderate-leverage commercial assets that need interest-only fit conduit CMBS, and transitional assets fit banks or debt funds.
Bridge Versus Permanent Positioning
The 30-day average SOFR of 3.87% sits roughly 123 basis points below the 10-year Treasury, and the Freddie Mac ARM indication of 5.80% to 5.90% is well below comparable fixed execution. We would not let that gap drive the decision. The September dot plot shows the median FOMC participant expecting one more 25 basis point hike in 2026, and futures pricing as of October 14 put the odds of a December hike near 63%. A single hike would erase roughly half or more of the floating advantage before rate cap costs. Our working assumption, which was not observed in this period’s indications, is that transitional bridge loans price at roughly 275 to 375 basis points over SOFR, implying coupons near 6.6% to 7.6%, at or above permanent fixed execution. Bridge debt is the right tool when the business plan will measurably increase NOI within the loan term, and the wrong tool when it is used only to wait for lower rates.
Protecting Against Rate and Spread Volatility
Use early rate-lock options where agency and life company programs offer them, even at a modest cost, given intraweek 10-year moves of 20 basis points or more.
On floating-rate debt, price rate caps before signing term sheets, budget for replacement caps at extension, and model debt service at the cap strike rather than at current SOFR.
Avoid closing timelines that straddle October 28 unless the rate is already locked or the borrower is comfortable with the volatility.
For refinances maturing in the next six to nine months, start the process now. Workouts and extensions are becoming more conditional, so the borrower who arrives early has more options than the one who arrives at maturity.
Investors
The maturity wall keeps producing motivated sellers. Lenders are extending only conditionally, increasingly asking for paydowns, new equity, cash management, or a defined exit, and recapitalizations of performing assets and lender-driven sales remain the opportunity set.
What This Means If You Are…
A Borrower with a Maturity in the Next 12 Months: Size the refinancing gap now with a cushion above indicative coupons, and begin the process six to nine months before maturity. Extensions are becoming more conditional, and the borrower who arrives early has more options.
A Multifamily Owner Weighing Agency Execution: Compare Freddie Mac and Fannie Mae at your leverage tier, price floating and fixed side by side, and model floating debt service at the rate cap strike. Expect underwriting to focus on trailing collections, concessions, and submarket supply.
An Investor Seeking Acquisitions: Prioritize performing assets whose problem is the capital structure rather than the property. Rising multifamily delinquency and special servicing will create sellers before they create price discovery.
What to Watch: October 16 to October 30
Rate risk is concentrated in the October 26 to 29 window, when auctions, the FOMC decision, and inflation data land within four days. Rate locks should be in place before October 28 where the program allows.
Supply signal for the curve that prices 5- and 7-year loans
Monday, October 26
2-year note auction
Read on front-end demand and hike expectations
Tuesday, October 27
5-year note auction; FOMC meeting begins
Direct input to 5-year fixed pricing
Wednesday, October 28
FOMC decision at 2:00 p.m. ET and press conference; 2-year FRN auction
Market odds favored a hold, roughly two-thirds as of October 14; no updated projections at this meeting
Thursday, October 29
Q3 GDP advance estimate and September PCE inflation, 8:30 a.m. ET; 7-year note auction
PCE is the Fed’s preferred gauge; the 7-year auction prices the base rate for 7-year agency and life company loans
Through late October
Remaining bank third-quarter earnings
CRE loan growth, office reserves, and nonperforming trends at regional banks
Through October
CMBS new-issue calendar
Up to 18 deals flagged, including four conduits; slippage would signal weaker conduit execution
Shortly after this window, expect Trepp’s October delinquency and special servicing reports in early November and the October jobs report on November 6. The next Senior Loan Officer Opinion Survey typically follows in early November, though we have not confirmed this year’s date.
Closing Reflection
Two weeks ago the benchmark was the story. Today it is only part of the story. Yields have eased, lenders remain open, and coverage still limits proceeds while credit performance gives credit committees more reasons to ask questions.
A market in which lenders want to lend but cannot size loans to the borrower’s needs is not distressed. It is cautious, and it rewards preparation.
The participants who do best over the next quarter will underwrite to coverage rather than to lower rates, choose structure and lender deliberately, and begin refinancings well ahead of maturity.
Caveats: Interest rate figures are unattributed market indications from the week of October 12 to 14, 2026. They are not quotes or commitments, and they move daily with Treasuries and SOFR. Bank and debt fund pricing was not observed this period, so those ranges are estimates. September delinquency and special servicing figures were drawn from published reports of Trepp’s data, and one figure varies by a basis point between reports. Self-storage, assisted living, and owner-occupied commentary reflects advisory judgment where national data were not available. Market-implied Fed probabilities shift with each data release and are not forecasts.
Navigating Today’s Market
The expert capital advisors at INSIGNIA Financial Services are dedicated to guiding you through evolving market dynamics with expert insight, deep capabilities, and tailored financing solutions. Whether you’re exploring options with banks, agencies such as Fannie Mae, Freddie Mac, and HUD, or debt funds, our team is here to help you secure the best possible terms for your commercial real estate financing.